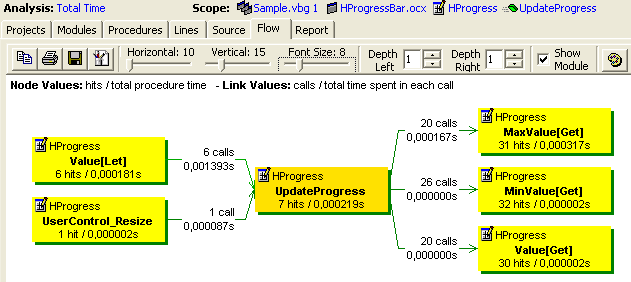
The VB Watch Profiler builds a graphical view of dynamic procedure calls, displaying values for both nodes (values for the procedure itself) and links (values for the relationship between 2 procedures). The values displayed depends on the display mode. See the graph title for exact info.

The graph is displayed for the currently selected procedure (see View Scope). Click a node to select another procedure and redraw the graph for this procedure. The selected procedure appears in an orange node.
|
You may select the call depth (see toolbar below) you wish to display. If additional procedures are beyond the call depth, they are represented with an arrow showing that there's more to see. The color of the arrow is the same as the node it represents, so you instantly know if it is interesting or not. |
|
Context menu
Right click on a procedure to pop up a context menu to load the original source and pinpoint the item in the original source code.
Toolbar

Copy to clipboard: copies the full graph, or the selected part if any, to the clipboard
Print: prints the full graph, or the selected part if any
Save as bitmap: saves the full graph, or the selected part if any, as a .bmp file.
Open in default .bmp editor: saves the full graph, or the selected part if any, as a temporary .bmp file and opens it in the default bmp reader.
Horizontal / Vertical: controls the horizontal / vertical spacing
Font size: controls the font size - acts as a zoom function
Depth: controls the number of levels of procedures to display. A=automatic: the Profiler tries to find the best depth so as to display a lot of data but keep a decent readability.
Show module: toggles on/off the module name visibility in procedure nodes.
Colors: brings this Options dialog.
No color- Color by % - Color by Value: determines the criteria
for coloring shadows of procedure nodes, from green (by
value:fast or by %: among the
fastest procedures) to red (by value:slow
or by %: among the slowest procedures) for
time analysis.
It has no effect for coverage analysis: shadows are grayed from white
(0% covered) to black (100% covered).